Racial and Ethnic Representativeness of U.S. Postsecondary Education Institutions
A project by Emily Bogle, Keaton Strawn, Sagma Prajapati, and Bridget Erb
Introduction
This dataset combines public data from the Integrated
Postsecondary Education Data System and the
US Census Bureau’s American Community Service
in an index of racial and ethnic representativeness
of US postsecondary education institutions. The data set
is originally sourced from Integrated Postsecondary
Education Data System and US Census American Community
Survey and was developed at the Urban Institute—made
available under the ODC-BY 1.0 Attribution License.
There are two data sets that are based on 4 years and
2 years college representativeness. 4-year college
representativeness contains 34 variables and the 2-year
college representativeness contains 30 variables.
The key variables are the "dif_" variables, which show the
representativeness for each racial category (white, black,
hispanic, asian, pacific islander, native american, mixed)
with a numerical value determined by subtracting a school's
percent enrollment of a certain racial group by the percent
of this group in a school's respective market. The market
was determined by the dividing the schools into urbanicity
categories (urban, suburban, rural) and determining how far
students travel to reach the school. Market distances
differed between both 2 and 4 year college groups and
urbanicity groups between these. Age also determined the
markets. Four year colleges looks at 18-24 year olds in a
121 mile radius for urban schools, 131 mile radius for
suburban schools, and 181 mile radius for rural schools.
Two year colleges look at 18-54 year olds in a 15 mile
radius for urban schools, 31 mile radius for suburban
schools, and a 34 mile radius for rural schools.
Variables in the data set include categorical variables for
each school's id, year, FIPS code, name, two or four year
category, public or private status, for profit status, and
selectivity categorization per the Carnegie classifications
of non-selective, selective, and more selective. Quantitative
variables in the set include total enrollment at each
school, percent enrollment at each college of each racial
group ("mcol_" variables), market percent for each racial
group ("mkt_" variables), and the previously mentioned
"dif_" variables for each group is the market percent minus the
percent enrollment.
Our Research Question:
"What do colleges who are closing the racial overrepresentation and underrepresentation gaps at a quicker rate (2009-2017) have in common as opposed to others with constant or increasing gaps?"
Methodology
We initially sought to determine the schools that are most rapidly closing representation gaps through using our own mathematical metric from one of six options:- Line of best fit using sum of difference magnitudes and compare slopes.
- Line of best fit using mean of squared differences and compare slopes.
- Establish an ideal line for ideal comparison using sum of difference magnitudes and a quadratic line type and perform regression analysis.
- Establish an ideal line for ideal comparison using sum of difference magnitudes and an exponential line type and perform regression analysis.
- Establish an ideal line for ideal comparison using mean of squared differences and a quadratic line type and perform regression analysis.
- Establish an ideal line for ideal comparison using mean of squared differences and an exponential line type and perform regression analysis.
Modeling
In the hopes of creating more accurate multiple linear regression models,
we wanted to see if there were any other variables not included within our dataset that would
be useful in predicting what factors led to some schools closing their gap faster than other schools.
We included data on additional variables relating to institutional characteristics, funding, costs and
fees, and money distributed by schools was obtained through the 'educationdata' package in R, making
calls to the Urban Institute's Education Data Explorer API. This resulted in 30 additional variables
to the ones we previously had.
Unfortunately, upon joining the datasets together we noticed quite a bit of missing data for a
lot of the added variables. Many values missing for certain schools, and some whole years or spans of
years missing. Our solution to this problem was to average across years to make a final set with one
row for each school, but this still yielded quite a bit of missing data which proved to be a problem
for us when it came time to make our models.
Our hopes for these models were to get at least an R^2 value of 10%. We expected that we would have
to do quite a bit of transformation of the variables to get a linear correlation, and then we could
run ANOVA tests to determine which groups of data were statistically significant. But as stated before,
the problems that we ran into when trying to accomplish this goal were largely due to missing data. But
removing any of them would result in removing 54% of our data.
For our qualitative variables, we did not see any significant correlations and none of the graphs
produced from trying to predict the rank of a school showed linearity. We had a bit more luck with
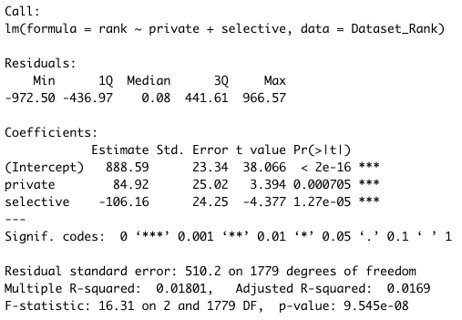
some of the categorical variables we added, but it still yielded a very low R^2. Our final model to
predict rank used the variables used the private and selective variables, results for this model were
as follows:
Results
Our results from our model indicated that post-secondary institutions classified as private tended to
have higher rankings, while more selective institutions tended to have lower rankings. While we do believe
our findings are significant, we also acknowledge that there are quite a few flaws in our methodology.
The biggest concern we have is with our missing data. We are only measuring MD rankings each year back to
2009 to 2017, so we have a very limited pool of data points to measure the rate at which each school is closing
its gap. This unfortunately could not be helped, and we do wish we had more data from previous and later years to
see more accurate trends.
Another problem we ran into was with the definition of Market Percent. In the Urban Institute report, they determined
this by taking the radius surrounding the institution using the 75th percentile of the distribution. However, this
radius did not expand across state lines, making schools like Princeton in New Jersey pull from a smaller pool to define
their Market Percent. This also does not account for how many schools pull in students from out of state. However, it
proved extremely difficult to come up with a better way of defining Market Percent, as each school is unique in its approach
to student recruitment. There is no monolithic way to define the Market, so we decided to use the metric we already had.